After looking for stocks/patterns to trade and creating a database of candidates over a number of years I wanted to know:
Is there a set of variables that will reliably predict how a stock is going to perform?
The question I’m trying to answer: using tracking data from my database (containing mostly low-priced, low-float stocks), which combination of factors known at 9:30 am (market open) give the highest winning probability for a short trade between 9:30 am and 12 pm?
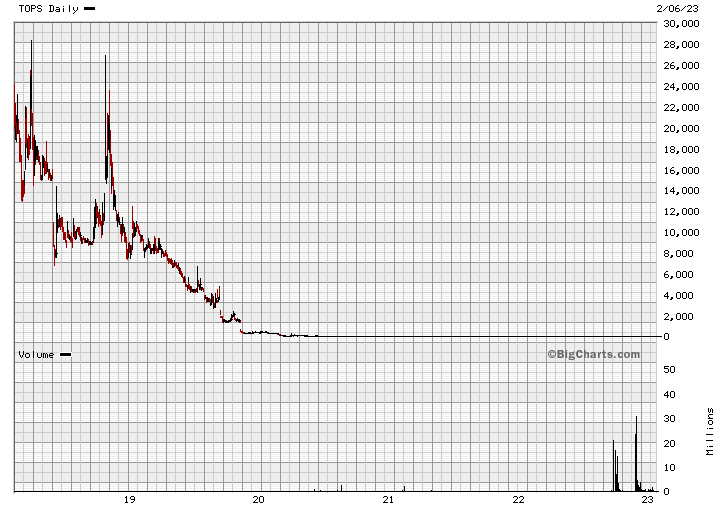
When I started researching which stocks to trade I noticed short-sellers targeting biotechs. The basic premise is that biotech stocks often have zero revenue while doing research. Since they still require (often substantial) funds they finance their operations by inflating the stock price. The company issues news and then sells new shares, diluting existing shareholders in the process. This pushes the stock price down. To bring the price back up, e.g., to be compliant with NASDAQ listing requirements, they do a reverse split. And then start all over again. This is how you get charts like the one below; TOPS is not a biotech but illustrates the concept nicely.

Ideally, a candidate should have its high before the low in the 9:30 am to 12:00 pm time window. There should also be a big percentage gap between the high and the low.
Data available at market open
Which data (available in database columns) is available at 9:30 AM that we can use to make a decision on whether we want to short a stock?
- Size of the float (number of shares available to trade on the market):
shs_float - Market capitalisation:
mkt_cap - How many shares have been traded during the pre-market session:
premkt_04:00:00_09:29:00_volume - How many times has float rotated during pre-market session:
premkt_04:00:00_09:29:00_volume_vs_shs_float - Highest price during pre-market:
premkt_04:00:00_09:29:00_high - Time at which the high occurred:
premkt_04:00:00_09:29:00_high_t - Lowest price during pre-market:
premkt_04:00:00_09:29:00_low - Time at which the low occurred:
premkt_04:00:00_09:29:00_low_t - The price at which the stock opened:
o - Sector:
sector - Industry:
industry - News (if any):
news_headline - Whether the company has filed a S-3 form:
dilution_filing - When the form was filed:
dilution_filing_date
The Jupyter notebook below does not yet use all available data but still provides a nice picture of what to look for. It’s available on Github.
Leave a Reply